Wind Turbine CFD
Objective: Analyze how air interacts with the blade of a wind turbine, and how that interaction causes the wind turbine to rotate
1. Geometry
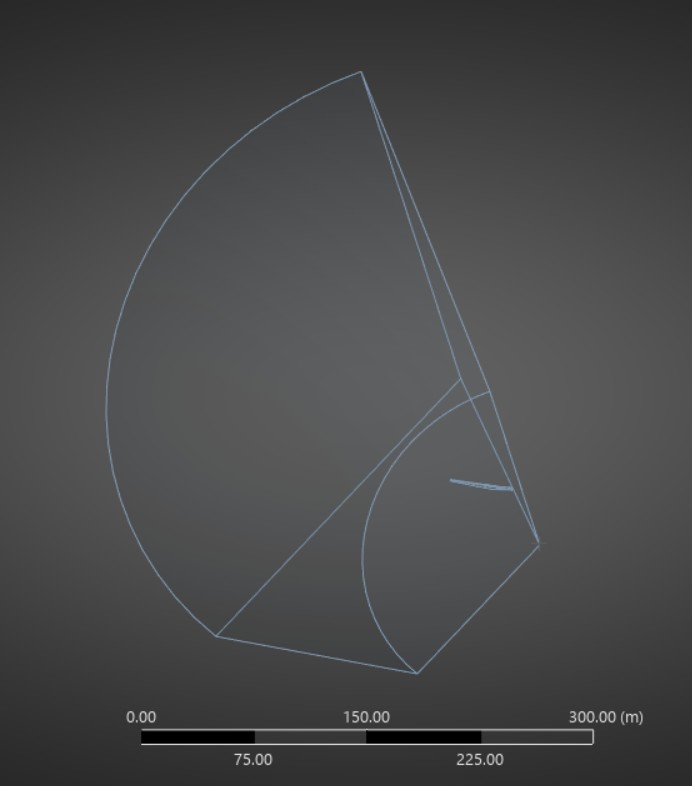
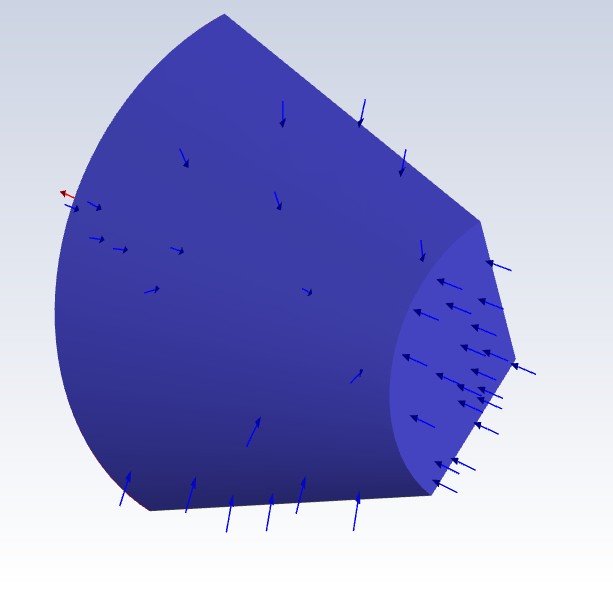
The geometry isolates a single blade from the three-blade wind turbine to allow for FLUENT to solve the problem faster. The two trapezoidal faces that can be seen are the parts in which the model was split. The model itself contains mostly fluid space, with the small body that can be seen towards the middle right being the single wind turbine blade. Therefore, the whole model has a cone like shape with a flat front and rear end.
2. Mesh
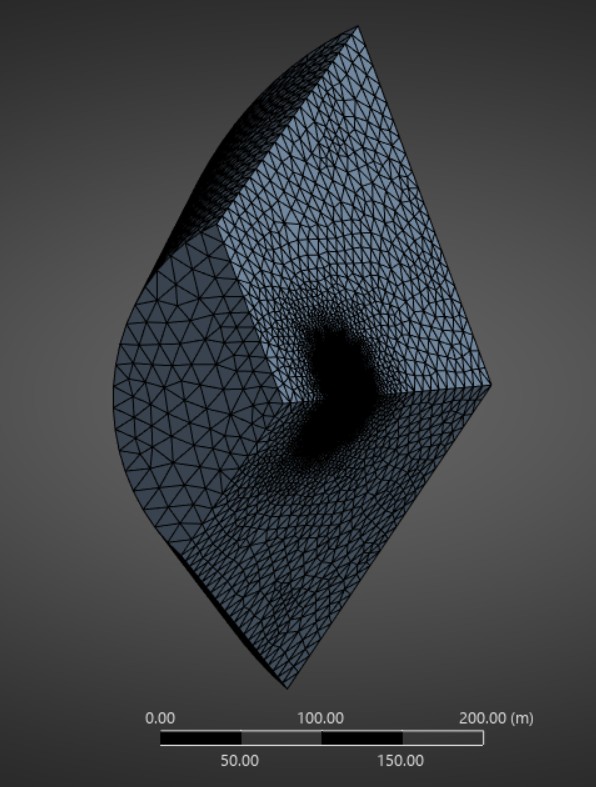
Full Mesh
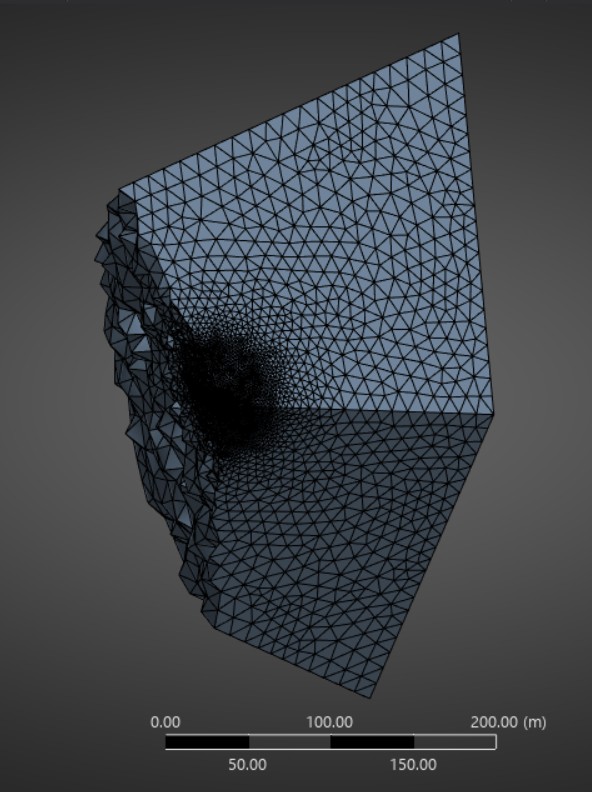
Side View with a Slice
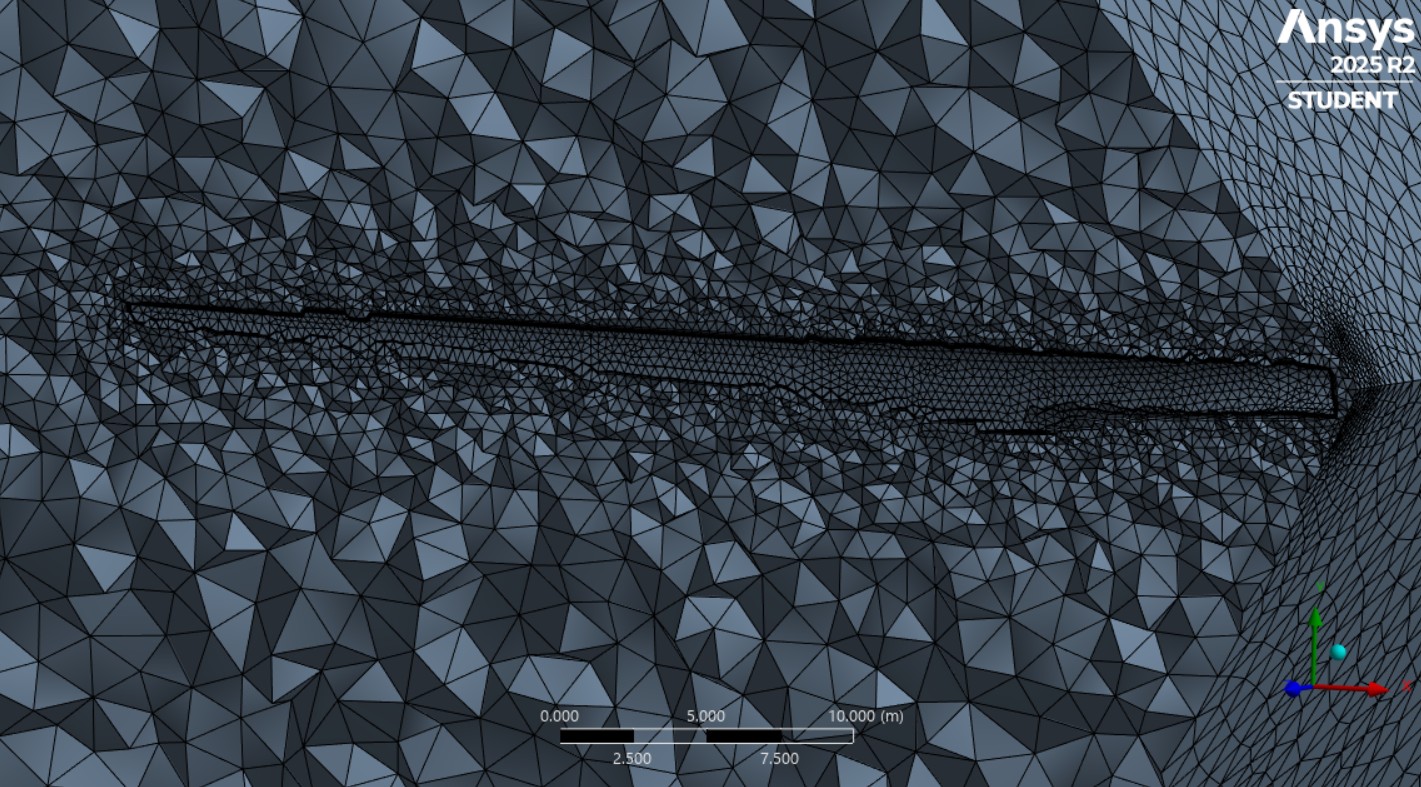
Near-Blade Mesh
The mesh was made manually. As shown, the mesh is much more refined near the blade, and gets coarser the larger the distance is from the blade. For the area near the blade, a sphere of influence-controlled mesh sizing was used with a sphere of radius 30 m and corresponding element size of 2 m. A face sizing on the blade surface was also used, with an element size of .3 m. To refine the mesh even further around the blade surface, custom inflation was implemented with a growth rate of 1.2 and 5 layers. Finally, a match control was added to the two periodic faces.
3. Setup
Inlets
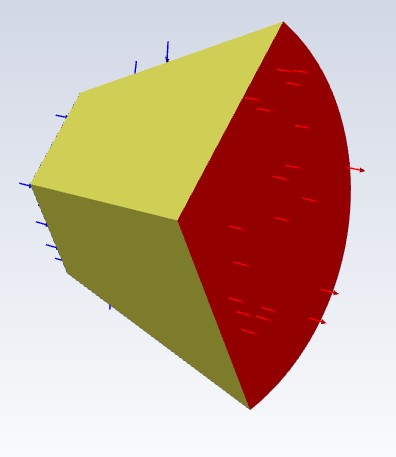
Outlet and Periodic Faces
Model: SST k-omega.
Fluid: Air at standard STP.
The curved face of the geometry and the smallest face of the geometry were set as inlets, and the larger hemispherical face was set as the outlet. The two remaining faces were set as interfaces, as they are the periodic elements that allowed the system to be duplicated twice to simulate a full wind turbine. The initial velocity was set to -12 m/s in the z-direction for both inlets to simulate normal winds. The outlet was set to have an exit pressure of 1 atm. The two remaining faces were set as periodic interfaces. The blade was treated as a wall.
4. Results
After the analysis had been completed, I plotted a number of different variables on the blade itself and the air surrounding it.
I first plotted the pressure contours on the blade surface, and around the blade at different x values. I found that on the front of the blade, the pressure was uniform, but on the backside of the blade there was a pressure drop near the end, which creates a lift force (which I show later), causing the blade to rotate and produce energy.
As for the pressure on the plane, I found that the pressure on the sides normal to the z-axis have lower pressures, and the pointed side normal to the y-axis has a higher pressure, hence the lift force.
Turbine rear pressure contour
Turbine front pressure contour
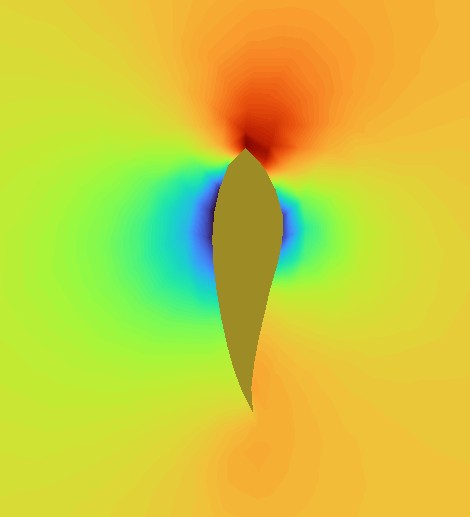
Fluid pressure contour on the plane at x= -10
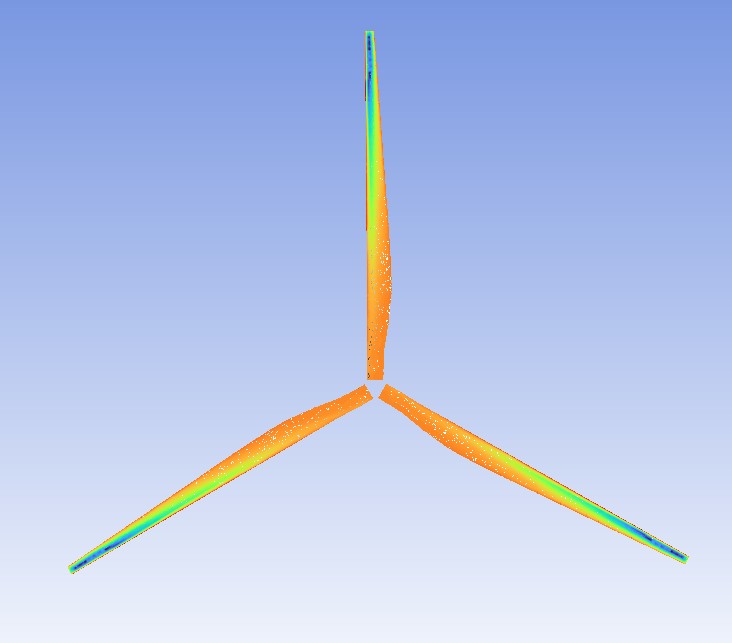
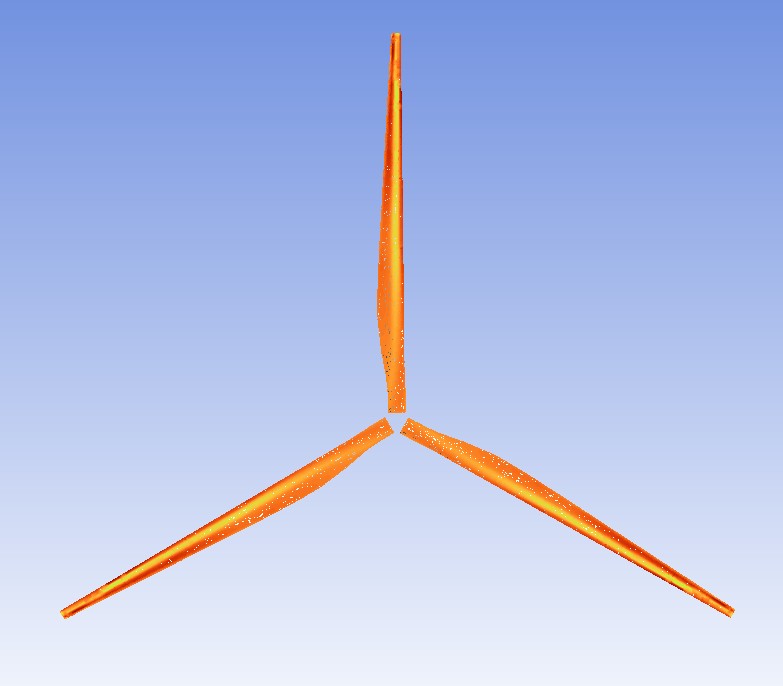
As shown below, I also plotted the velocity vectors and streamlines. On the left hand side image, it can be seen that the fluid slows (blue & green arrows) at higher pressures, and speeds up (red arrows) at lower pressures, which follows Bernoulli’s Principle, which acts as a form of validation of the solution.
On the right hand side image, velocity streamlines are shown, originating from the inlet. These streamlines strongly show that the energy in the fluid decreases dramatically after it comes in contact with the turbine, meaning that the energy is transferred from the fluid into the turbine, causing rotation and therefore energy to be produced from the turbine. Essentially, the turbine is extracting energy from the wind and transforming it into mechanical torque to generate power.
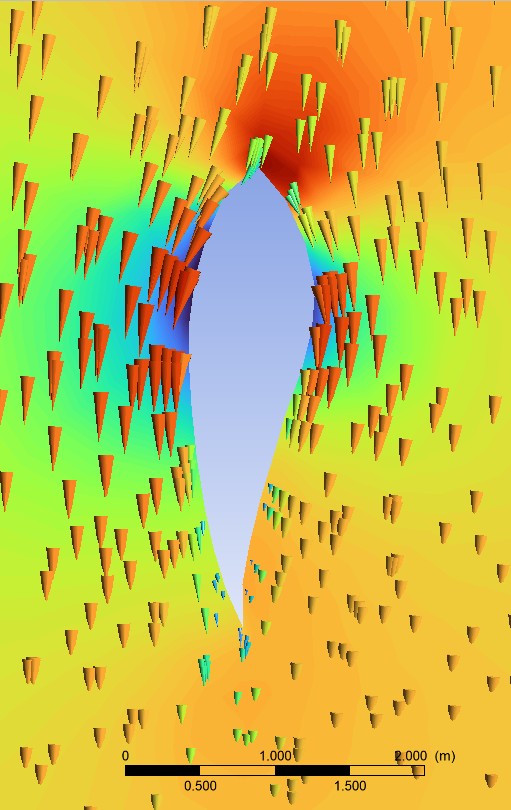
Velocity vectors at x = 10
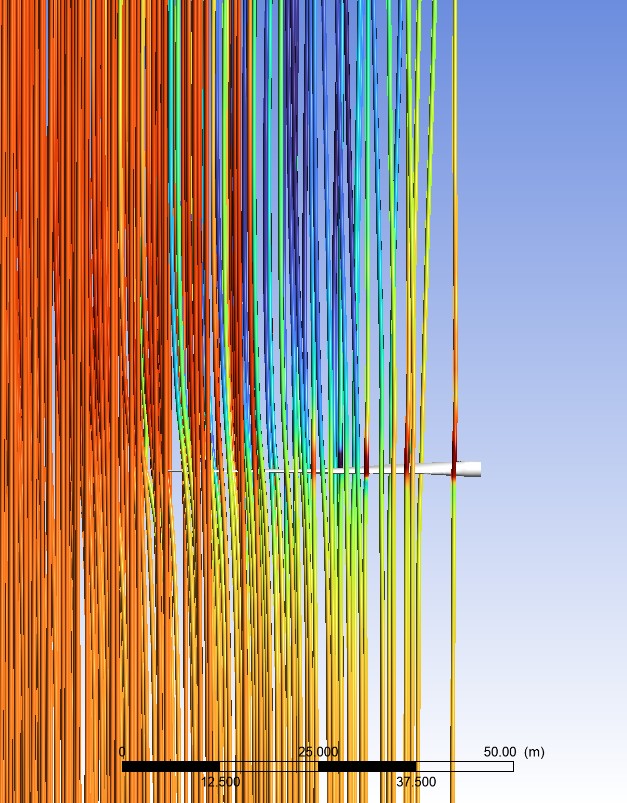
Velocity streamlines originating at the inlets
Technologies Used: Spaceclaim, ANSYS Mechanical, ANSYS Fluent, ANSYS CFD-Post