
Summary
The final project in the MAE 3270: Mechanics of Materials course was to identify a wrench design and material that could meet a series of safety factor constraints, including yield strength, fracture toughness, and cyclic loading. After chosing a design, students had to CAD the model and test its performance in ANSYS Static Structural. Comparing FEA results to simplified hand-calculations, students got a better understanding of where the assumptions made in simplified equations were valid or not.
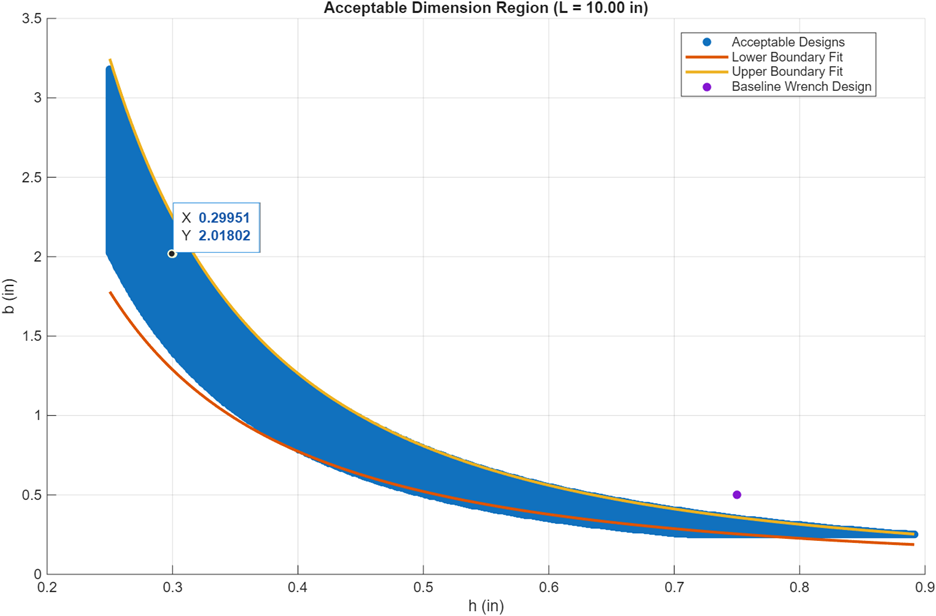
0. Identifying Design Range
Safety factors and strain criteria (as bulleted below) provided the retraints on the optimization process. After a few quick calculations, it became clear that titanium was the main material option which would meet the strain criteria. It was therefore chosen for the full matlab range analysis. The main code segment governing this process is written below, featuring a double nested loop gathering all acceptable designs.
- \(X_0\) = 4 for yield or brittle failure, depending on the material.
- \(X_K\) = 2 for crack growth with an assumed 0.04 in crach length.
- \(X_S\) = 1.5 for fatigue stress at 1,000,000 cycles.
- \(1.0 \frac{\text{mV}}{\text{V}}\) output at the rated torque of \(600 \text{in-lbf}\).
% --- Ti-6Al-4V ---
E        = 16.3e6;   % Young's modulus (psi)
nu       = 0.332;   % Poisson's ratio (not used directly here)
su       = 114e3;  % tensile (or yield) strength (psi)
KIC      = 94.2e3;   % fracture toughness (psi*sqrt(in))
sfatigue = 88.9e3;  % fatigue strength for 10^6 cycles (psi)
a0       = 0.04;   % assumed crack depth (in)
Y        = 1.12;   % geometry factor for surface crack


% Safety factor requirements
Xo = 4.0;   % strength safety factor
XK = 2.0;   % fracture (K) safety factor
XS = 1.5;   % fatigue safety factor

%% ---- Design variable ranges ----
L = M / F;
fprintf("Wrench Length: %.2f in\n", L);
h_vec = linspace(0.25, 4, 5000);
b_vec = linspace(0.25, 4, 1000);

nh = numel(h_vec);
nb = numel(b_vec);

% Logical array of acceptable designs
ok = false(nh, nb);

% Optional: store SFs and output for plotting / inspection
SF_strength = zeros(nh, nb);
SF_crack    = zeros(nh, nb);
SF_fatigue  = zeros(nh, nb);
output_mVV  = zeros(nh, nb);

%% ---- Sweep over h, b ----

% End load P that gives torque M = P*L
P       = M / L;
M_fixed = M;             % max bending moment at drive (for failure)
M_gauge = P * (L - c);   % bending moment at gauge (for output)

for ih = 1:nh
    h = h_vec(ih);
    for ib = 1:nb
        b = b_vec(ib);

        % Section properties
        I = b * h^3 / 12;

        % ---- Stresses at fixed end (for failure checks) ----
        sigma_max = 6 * M_fixed / (b * h^2);  % psi

        % Strength safety factor
        SFs = su / sigma_max;

        % Fracture safety factor
        KI  = Y * sigma_max * sqrt(pi * a0);  % psi*sqrt(in)
        SFk = KIC / KI;

        % Fatigue safety factor (fully reversed)
        SFf = sfatigue / sigma_max;

        % ---- Gauge strain and output (at gauge location) ----
        sigma_g = 6 * M_gauge / (b * h^2);  % psi at gauge
        eps_g   = sigma_g / E;              % strain at gauge
        out     = 1e3 * eps_g;              % mV/V for half bridge with GF ≈ 2

        SF_strength(ih, ib) = SFs;
        SF_crack(ih, ib) = SFk;
        SF_fatigue(ih, ib) = SFf;
        output_mVV(ih, ib) = out;

        % ---- Acceptable design check ----
        ok(ih, ib) = (SFs >= Xo) && ...
            (SFk >= XK) && ...
            (SFf >= XS) && ...
            (out >= 1.0);   % >= 1.0 mV/V
    end
end
The code’s output was graphed to illustrate a range of viable values from which the current wrench dimensions were chosen. All values were plotted as scatter points, so rough curve fit functions were made to represent the lower and upper bounds of the data trend. Also pictured in the graph is the previous wrench configuration, which clearly falls out of the acceptable region.
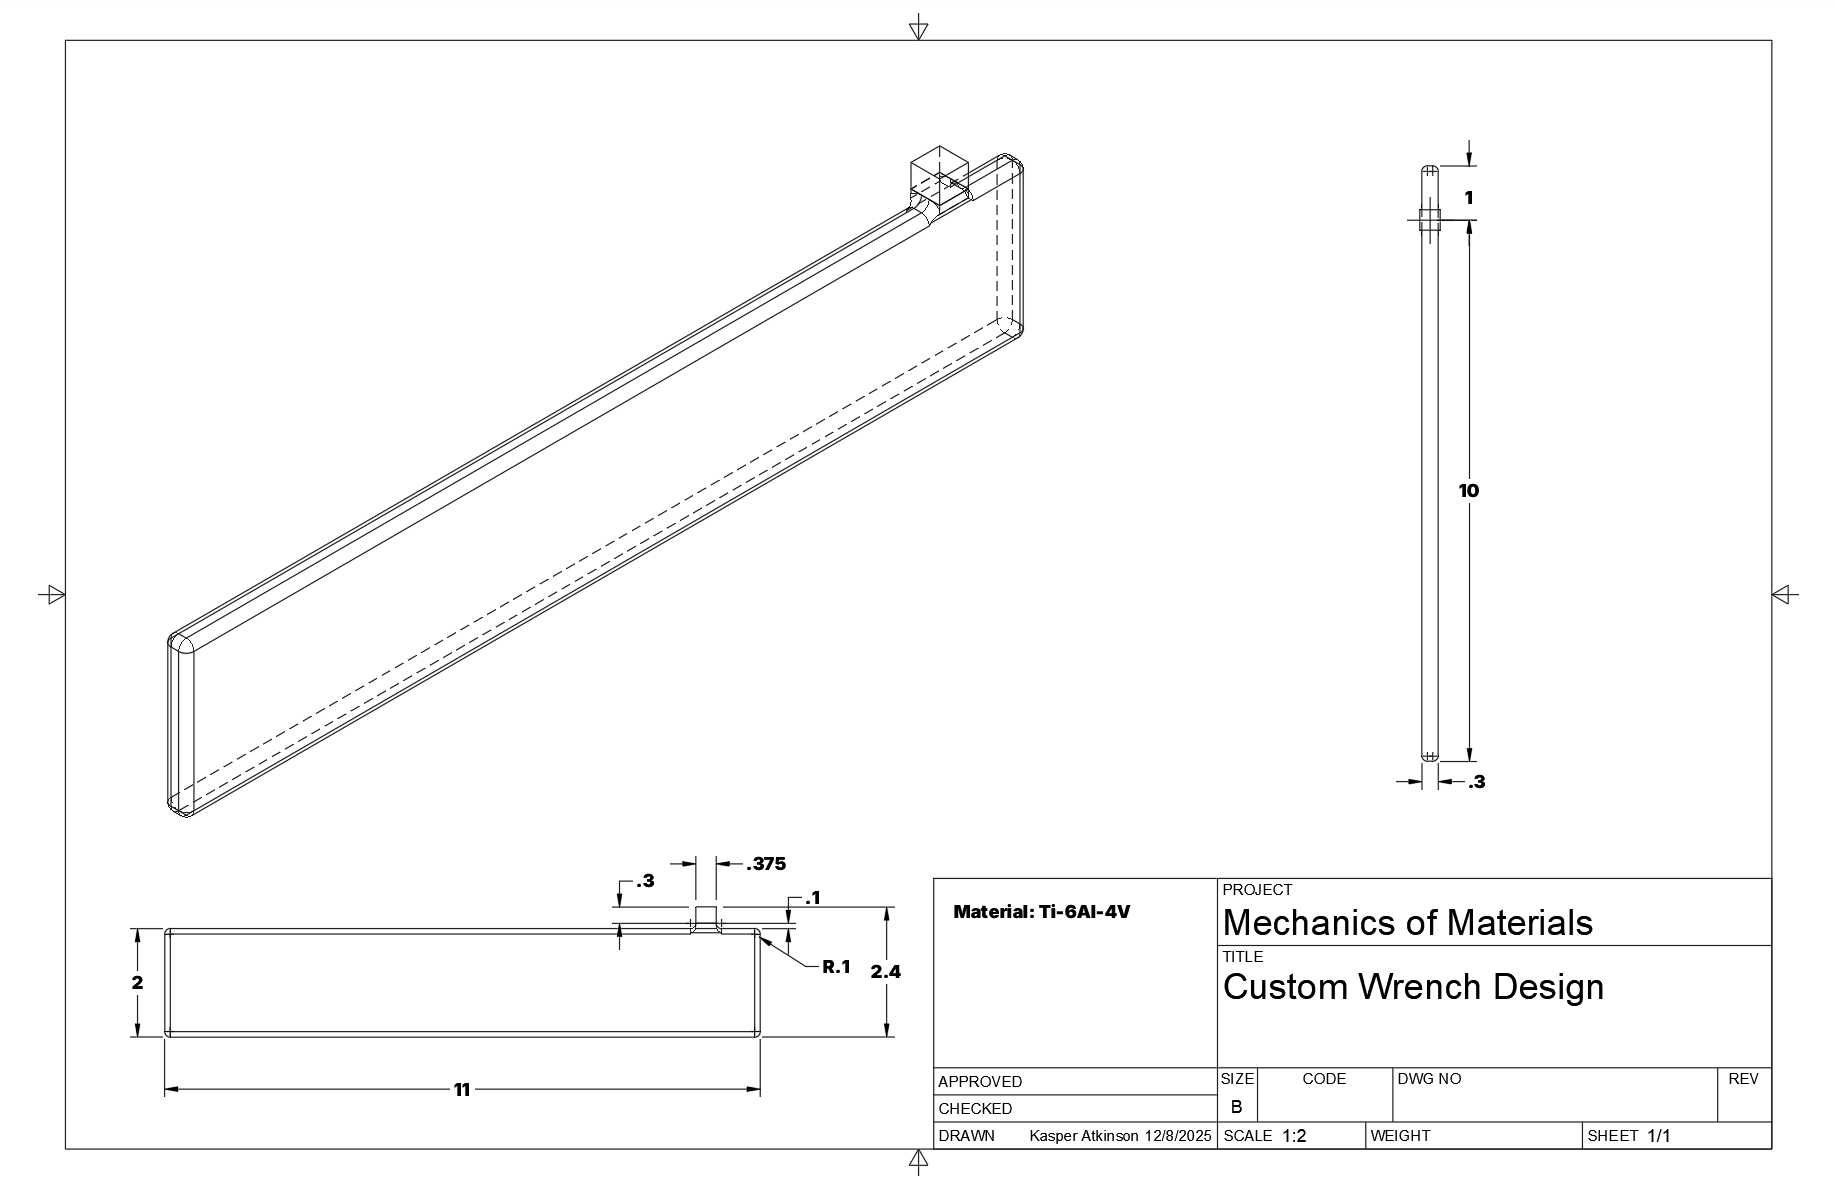
1. CAD Model With Key Dimensions
Below is the full production drawing of the final wrench design, including all critical dimensions needed for manufacturing and FEM reconstruction.
2. Material & Relevant Mechanical Properties
The wrench was fabricated from Ti–6Al–4V, which was the only material found to fit the material strain requirement.
Key properties used in both hand calculations and FEM:
- Young’s Modulus: 16.3×10⁶ psi
- Poisson’s Ratio: 0.332
- Yield Strength: 114 ksi
- Fracture Toughness: 94.2 ksi·√in
- Fatigue Strength (10⁶ cycles): 88.9 ksi
- Density: 4.43 g/cm³ (not structurally relevant but included for completeness)
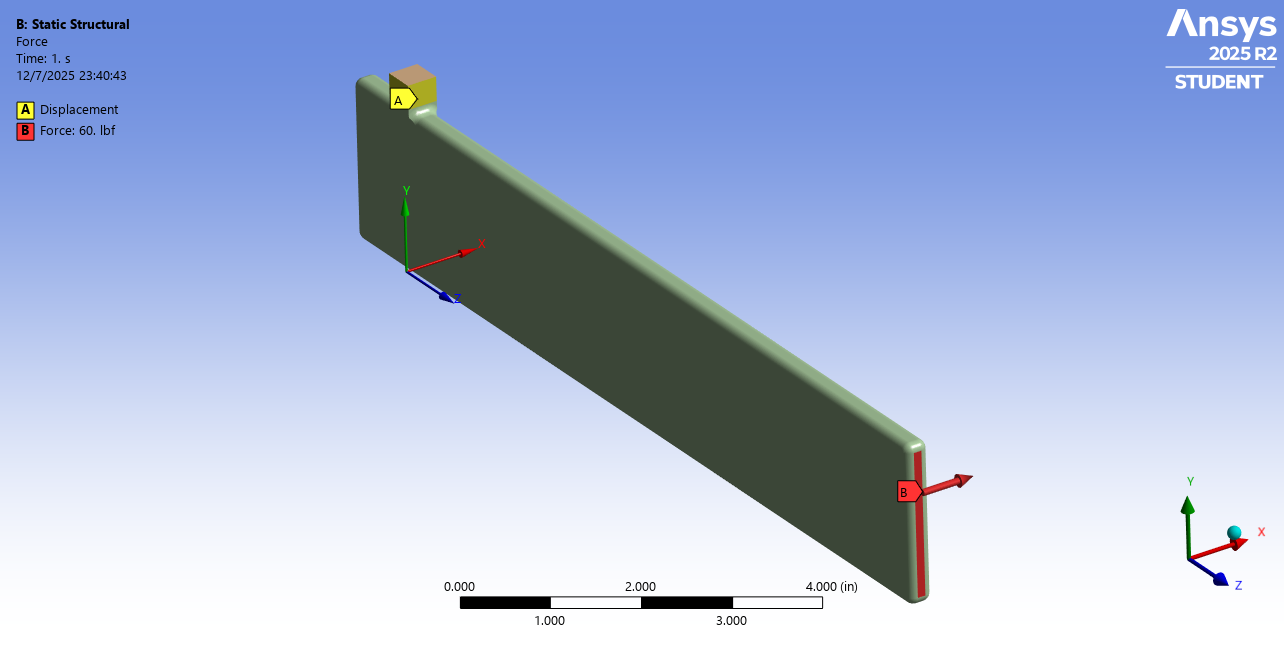
3. FEM Load & Boundary Condition Diagram
The FEM setup followed the course instructions exactly and is illustrated in the ANSYS image below.
- The top \(0.4 \text{in}\) of the drive block was fully constrained (zero displacement), show in the yellow highlighted sides.
- A lateral force was applied at the wrench tip such that \(F = \frac{600\ \text{in-lbf}}{L}\) matched the required torque as in the red arrow.
- A local coordinate system was created at the strain-gauge location to measure strain in the correct direction.
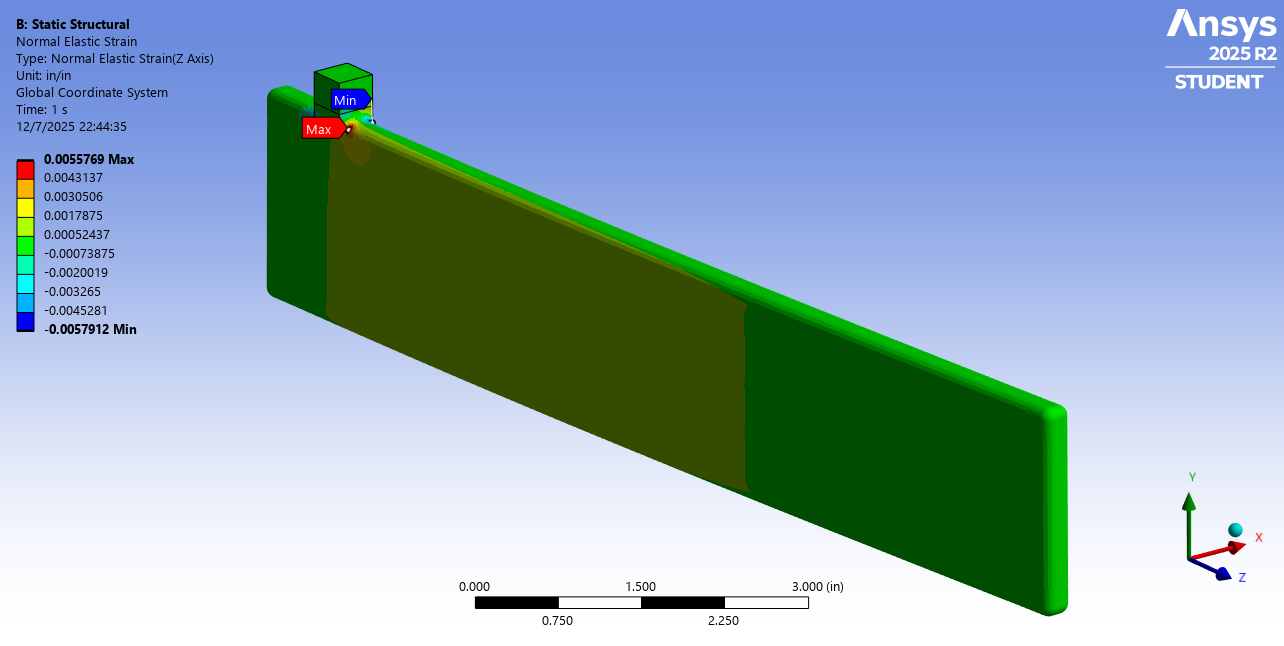
4. Normal Strain Contours (Gauge Direction)
Here is the strain distribution along the gauge axis. This was taken from the custom coordinate system aligned to the expected strain-gauge orientation. Peak gauge-direction strain from the probe was \(\approx 5577 \mu \epsilon\).
5. Maximum Principal Stress Contour
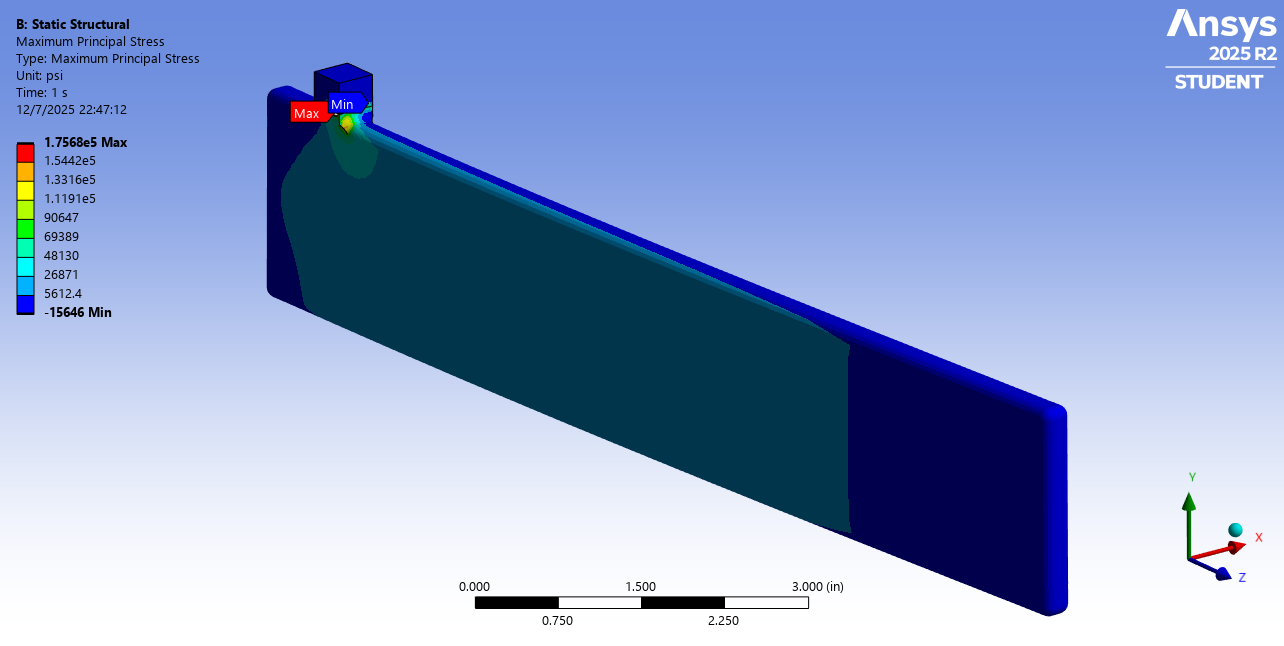
Maximum principal stress from the FEA was \(\approx 175.7 \text{ksi}\), occuring at the stress concentration of the driver head. Despite fillets being added to the CAD model, this did not significantly aleviate the effect.
6. Summary of FEM Structural Results
Maximum Normal Stress (anywhere):
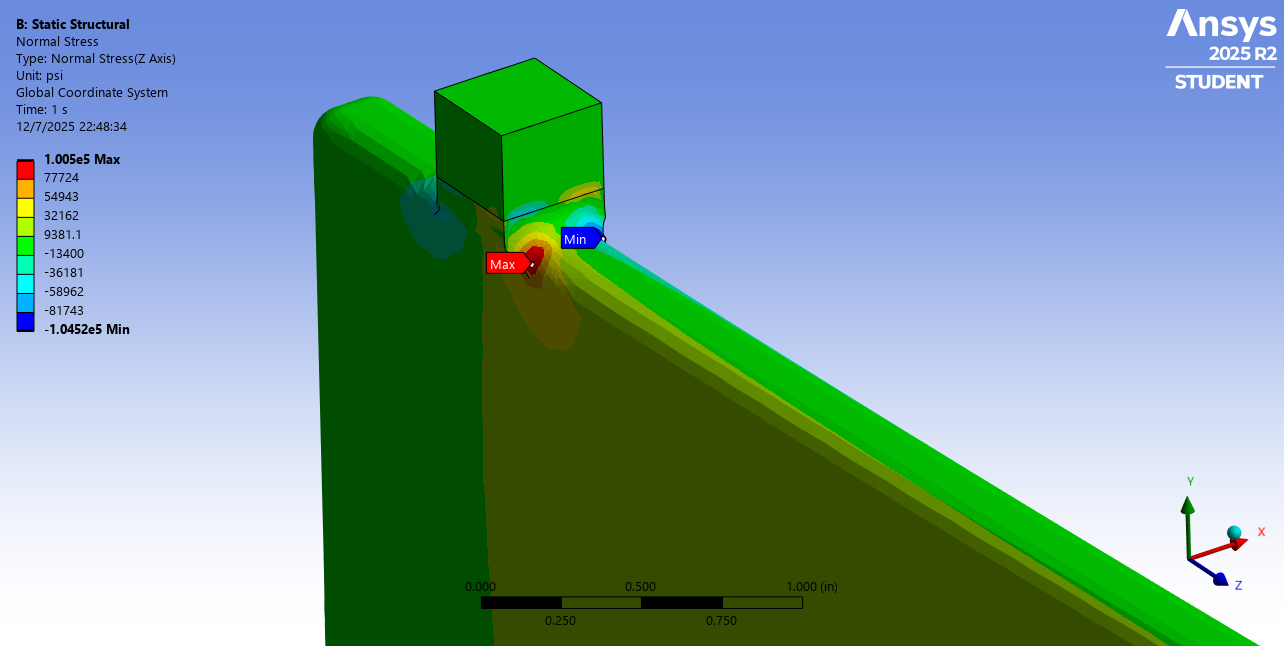
The maximum normal stress of \(\sigma_N \approx 100.5 \text{ksi}\) occurs at the same place of maximum normal strain as expected, and is much greater than the surrounding stress due to the stress concentration of the driver.
Tip Deflection Under 600 in-lbf Equiv. Load:
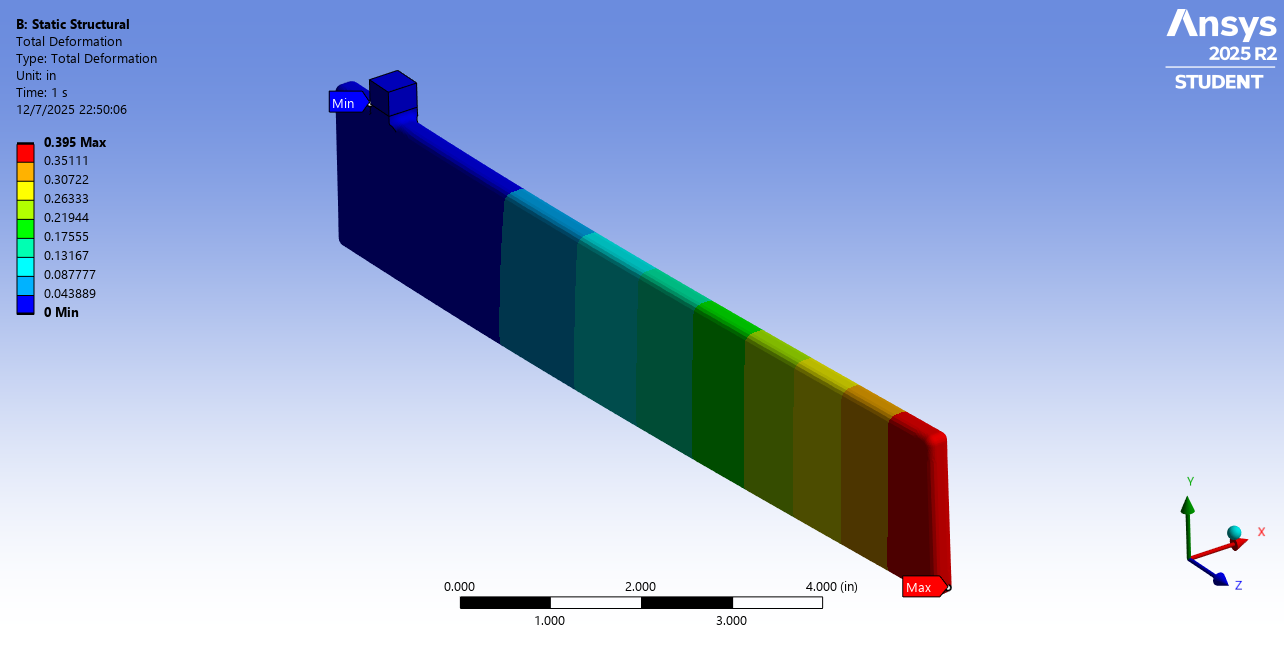
The maximum load deflection of \(\delta_{tip} \approx 0.4 \text{in}\) occurs at the very tip and aligns with hand-calculations more than the stress concentration-influenced values.
Strain at Gauge Location (Z-axis / gauge direction):
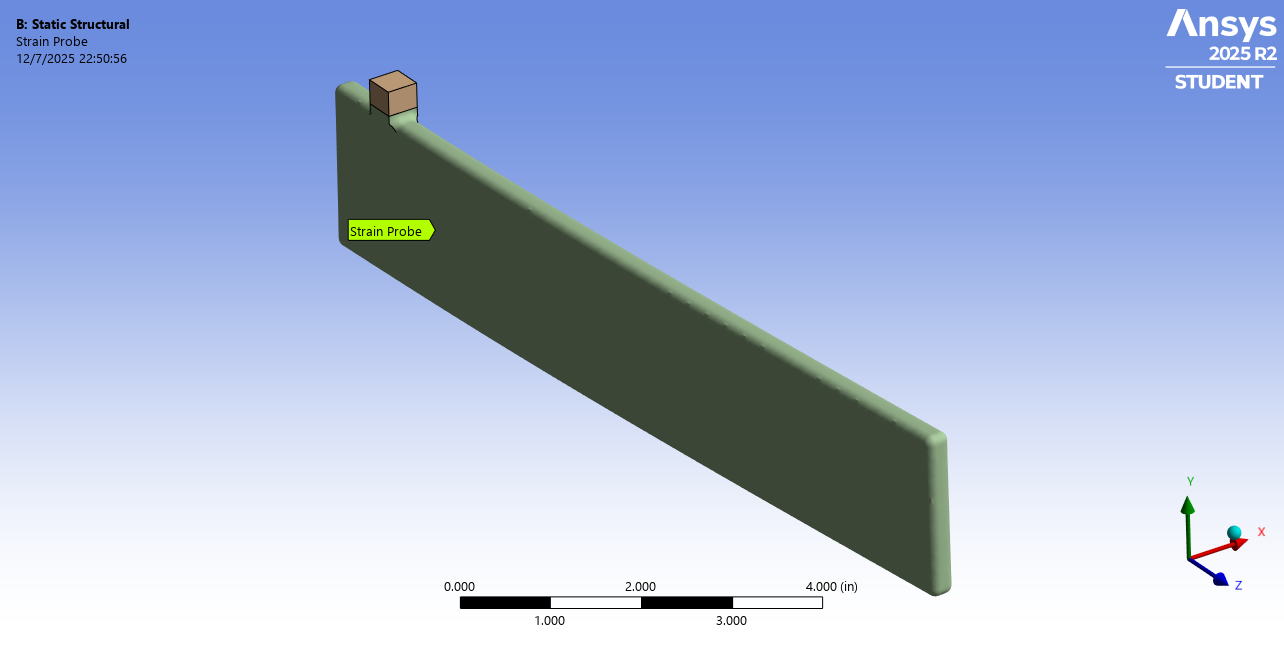
The raw probe result panel from ANSYS can be seen below in the following section.
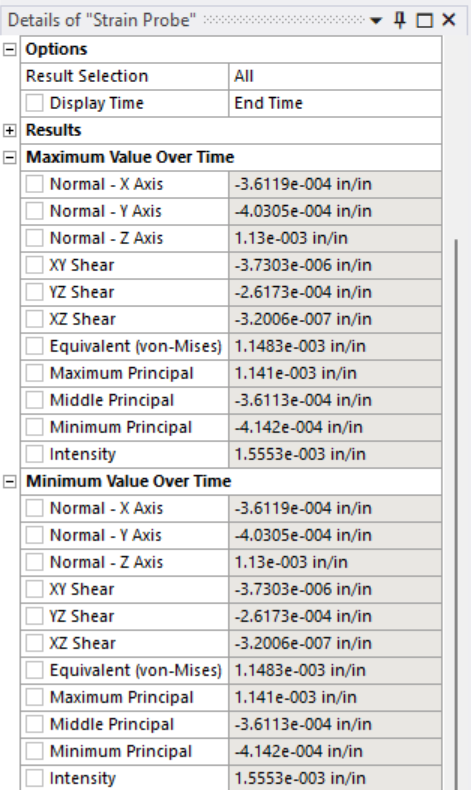
7. Torque Wrench Sensitivity (mV/V)
Strain-gauge sensitivity is computed from \(\text{Output (mV/V)} = 10^3 \cdot \varepsilon_{\text{gauge}} \cdot \text{GF}\). Because the strain guage simplifies down to a half-bridge, a gauge factor \(GF = 1.0\) satisfies the geometry and yields a sensitivity of \(1.13 \text{ mV/V at 600 in-lbf}\) in the Z-normal direction.
8. Strain Gauge Selection
A Micro-Measurements EA-06-031DE-120 linear foil gauge was identified. Its values were taken from the datasheet: https://docs.micro-measurements.com/?id=2423. Its length was \(0.27 \text{in}\) and \(0.12 \text{in}\) for width. This small configuration guaranteed it fit in the proposed wrench design even with the fillets compromising some flatness of the wrench side.